
How India Is Searching for Cooler Homes in 2027 – AResearch
India’s search for a cooler home is still mostly a search for an air conditioner. The design measures that cut the heat before it needs one are a small, fast-growing and strongly regional slice.
Ask where Indian households look when a home gets too hot and the answer is short. Of the cooling-related searches we measured on one scale (leaving out mixed-intent building terms), 63% were about air conditioners, 32% about fans, coolers and ventilation, and 4.8% about roofs, walls, paint, shading and glazing. The design slice is small, but it is moving. In the year to October 2026, interest in shading and glazing searches rose 45% on the year before, and roof, wall and paint searches rose 35%. This article sets out what people search for, when, and where; how news coverage and company records line up with that; and where the evidence stops.
What we measured
One question runs through the piece: how does interest in passive and design-led cooling compare with interest in air conditioning, and does it follow the same calendar and the same map? We used four signals.
- Search interest in India, November 2021 to October 2026, for 35 home-cooling searches placed on one common scale, plus 10 years of monthly history (2016 to 2026) for seasonality and growth, and state-level scores for 35 states and territories.
- News and blog articles published in India that mention home-cooling vocabulary: 3,474 articles over two 12-month windows, June 2024 to May 2025 (1,944) and June 2025 to May 2026 (1,530).
- Company records in India whose descriptions mention insulation, glazing, ventilation, air conditioning or home solar.
- Research papers, 2017 to 2025, with cooling-related building terms in the title.
A “design-led” or “passive” measure here means anything that reduces heat gain without running a compressor: cool roofs, reflective and heat-resistant coatings, wall and roof insulation, window film, jali screens, pergolas, curtains and natural ventilation. We count searches and mentions, not purchases or installations.
Finding 1: air conditioners and fans fill the search list
Chart 1 ranks the 25 largest of the 35 searches, scaled so that “ceiling fan” equals 100. The top of the list is dominated by buying questions: “1.5 ton ac” (163), “split ac” (82), “inverter ac” (75), “air conditioner” (72) and “window ac” (71). Efficiency questions sit inside that list: “5 star ac” scored 58 and “best ac” 53. Another efficiency search, “ac star rating”, was too small to place on the common scale, but its growth is described below.
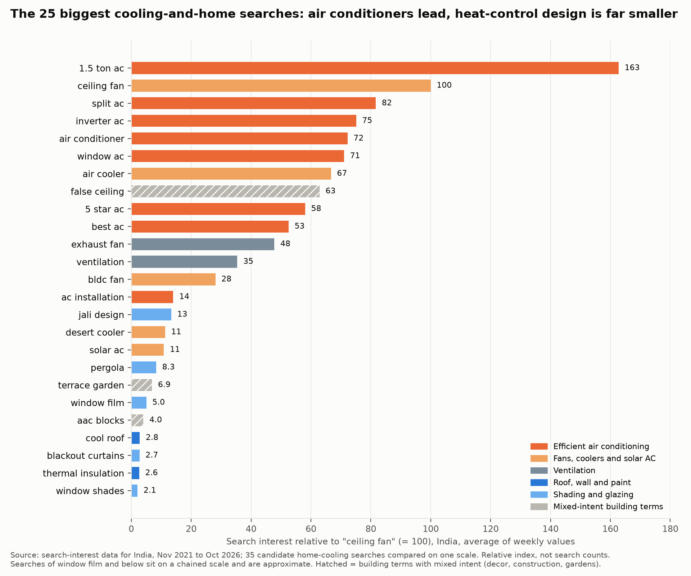
Chart 1. The 25 largest of 35 cooling-related searches in India, relative to “ceiling fan” = 100.
Design searches come far lower. “Jali design” scored 13, “pergola” 8.3, “window film” 5.0, “cool roof” 2.8 and “thermal insulation” 2.6. The roof, wall and paint group, ten searches in total, adds up to 12.8 points, against 587 for the eight air-conditioner searches, a ratio of about 1 to 46. Several tested terms were too small to rank: “heat reflective paint” scored 0.2 and “double glazed windows” 0.01. Two mixed-intent building terms also rank high: “false ceiling” (63), which is largely a décor search, and “terrace garden” (6.9). We show them hatched and left them out of the group totals.
Government planning describes the same pattern from the other side. The India Cooling Action Plan projects nationwide cooling demand growing about eight times between 2017-18 and 2037-38, and building cooling demand nearly eleven times (Ministry of Environment, Forest and Climate Change, 2019). It also notes that about 70% of homes using a room air conditioner run fans at the same time, and that many households may not afford air conditioning for 10 to 20 years, so natural ventilation, fans and passive measures stay important.
Finding 2: design interest peaks in the same month as air conditioning
If passive design were being planned ahead of summer, its searches would rise earlier than air-conditioner searches. They do not. Averaged over 2022 to 2025, every group peaks in April.
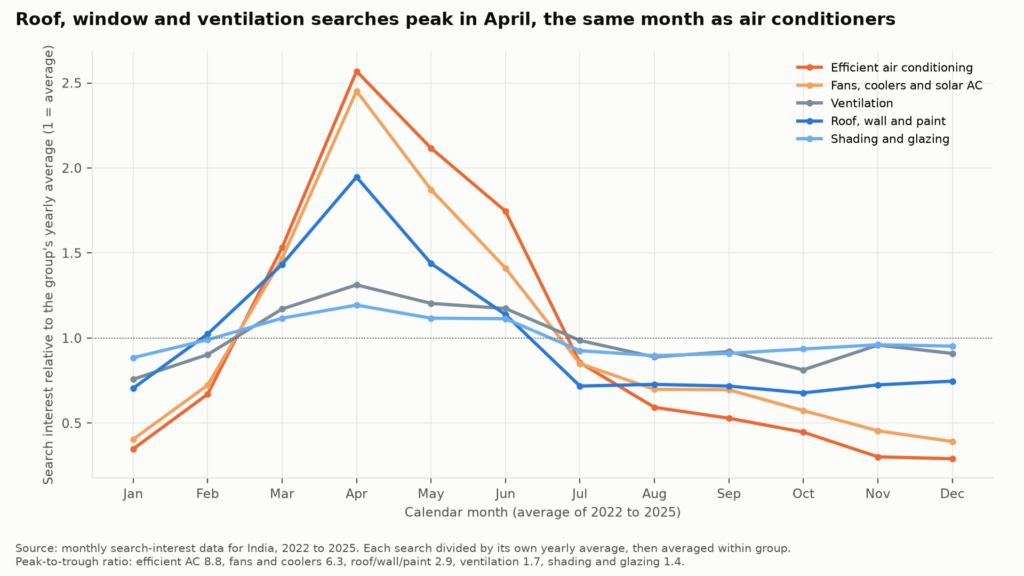
Chart 3. Monthly search interest by group relative to its yearly average, 2022 to 2025.
Air-conditioner searches in April ran at 2.6 times their yearly average and sit 8.8 times above their quietest month. Roof, wall and paint searches peaked at 1.9 times average in April, 2.9 times above their low. Ventilation and shading and glazing are flatter, at 1.7 and 1.4 times between peak and low. Roof work and window treatments are decisions that need weeks of lead time, yet attention arrives when the heat does. Roof, wall and paint searches do start climbing slightly earlier than air-conditioner searches: in February their index is 1.02 against 0.67 for air conditioners.
News coverage shows the same bunching, with one difference. In 2025, design-measure articles peaked in April (29 articles) alongside air-conditioner coverage. In 2026 they peaked in February (26 articles, with 24 in March), two months before the air-conditioner coverage peaked in April (185 articles). One year is not a trend, but it is the pattern the search seasonality says is missing.
Finding 3: every group grew in the latest year, shading fastest
We indexed each group’s search interest so that the year November 2021 to October 2022 equals 100.
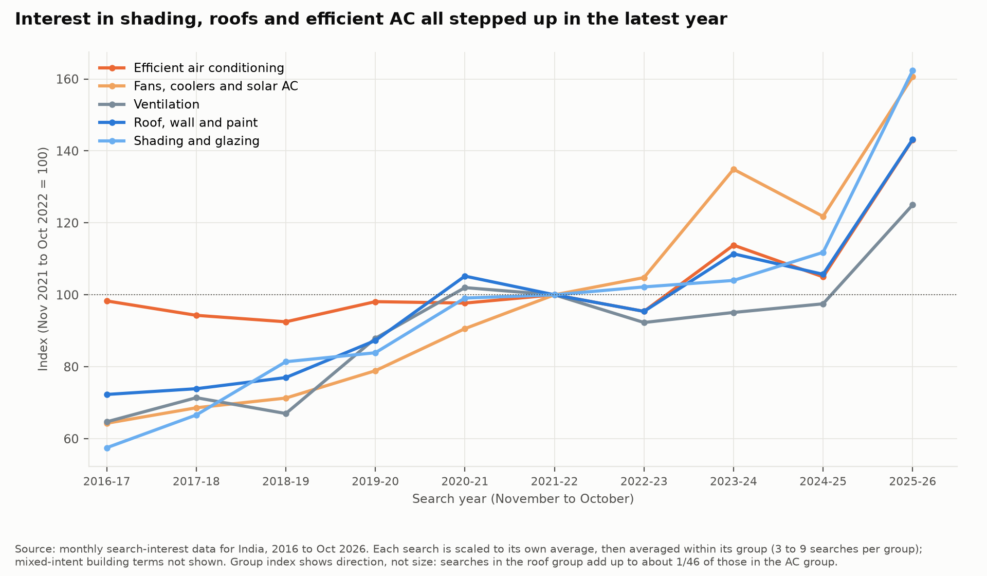
Chart 2. Group trend index, search years November to October, 2016-17 to 2025-26.
In the year to October 2026, shading and glazing stood at 162, fans, coolers and solar AC at 161, roof, wall and paint at 143, efficient air conditioning at 143 and ventilation at 125. The year before, the same groups stood at 112, 122, 106, 105 and 98. A group index shows direction, not size: a rise in the roof group is a rise from the roughly 1-in-46 base described above. We did not test why the latest year was higher; it may reflect weather as much as intent.
Individual searches show where the energy is:
- Rising fast: “blackout curtains” 3.5 times its 2021-22 level, “bldc fan” 3.6 times, “window film” 2.1 times, “roof insulation” 2.1 times, “ac star rating” 1.9 times, “5 star ac” 1.8 times, “wall insulation” 1.7 times.
- Rising modestly: “passive cooling” 1.5 times, “cool roof” 1.4 times, “thermal insulation” 1.35 times.
- Flat or falling: “pergola” 0.96, “terrace waterproofing” 0.97, “heat resistant paint” 0.95, “jali design” 0.75, “aac blocks” 0.70, “terrace garden” 0.69 and “false ceiling” 0.65.
The pattern is that questions about doing something to an existing home, such as film, curtains and roof or wall insulation, are growing, while construction-stage and décor terms are shrinking. Several of these are small series reported in whole numbers, so differences of a few points are noise.
Finding 4: the map splits north and south
We scored each state’s relative interest in two groups: efficient air conditioners (six searches) and roof, wall and shading searches (nine searches). A score of 100 means the state where that search is most concentrated; each state’s score is the average across the searches in the group. Ten states and territories had too little design-search data to score, mostly in the north-east and the islands.
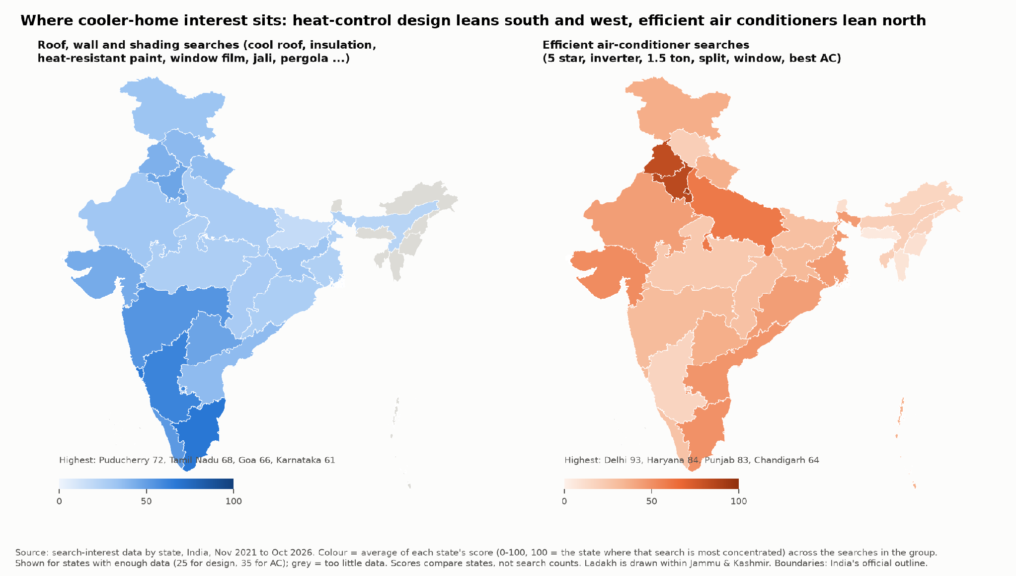
Map. State scores for roof, wall and shading searches (left) and efficient air-conditioner searches (right). Grey = too little data.
Design interest leans south and west: Puducherry (72), Tamil Nadu (68), Goa (66), Karnataka (61) and Maharashtra (54) lead, with Chandigarh (54), Kerala (52) and Delhi (49) next. It is lowest in Bihar (17), Assam (23) and West Bengal (25). Efficient air-conditioner interest leans north: Delhi (93), Haryana (84), Punjab (83), Chandigarh (64), Puducherry (60) and Uttar Pradesh (59) lead. Karnataka scores 61 on design and only 17 on efficient air conditioners; Delhi scores 93 on air conditioners and 49 on design. Across the 25 states with both scores, the correlation is 0.21, so a state strong in one is not reliably strong in the other. The roof and shading composites agree with each other more (0.59).
We did not test why. Climate, housing stock, electricity tariffs, building types and who searches online could all play a part, and these scores compare states against their own search mix, not against each other in volume.
Finding 5: supply is less lopsided than search
Company records give a third angle on “how design interest aligns with available home solutions”. Among 351,457 India company records in our registry sample, 134 have descriptions mentioning insulation, reflective or cool coatings, and 275 mention windows, glazing, films or shading. Ventilation and fans appear in 490 and air conditioning and HVAC in 1,263. Home solar appears in 1,112.
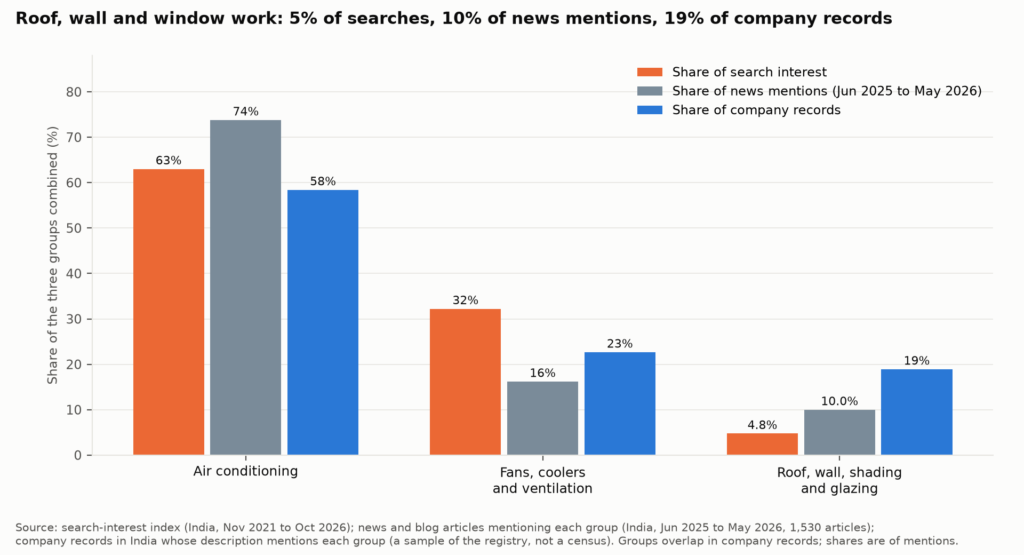
Chart 4. Share of three signals held by air conditioning, fans and ventilation, and roof, wall, shading and glazing.
Roof, wall, shading and glazing is 4.8% of search interest, 10.0% of the 1,530 recent news articles and 19% of the company records in these three groups. The newer-company share is similar across groups: 24% of insulation records, 31% of glazing, 24% of ventilation and 25% of air-conditioning records name a founding year of 2019 or later. Maharashtra holds the most records in every group, with 22% of both the insulation and the air-conditioning records. Gujarat (18 of 134) and Tamil Nadu (14) follow in insulation, and Tamil Nadu (31 of 275) and Telangana (27) in glazing. Records are a sample of company descriptions, not a count of firms or sales, and one company can appear in more than one group.
The result is a reading, not a verdict: design solutions have more supplier presence than search demand would suggest, so the constraint on adoption may sit with awareness and ease of choosing a product, which these data cannot show.
What the news is talking about: rising and falling themes
We compared how India’s home-cooling coverage was framed across the two 12-month windows. The pool is articles published in India with home-cooling vocabulary (air conditioners, fans and coolers, or passive measures) in the opening text or tags. It fell from 1,944 to 1,530 articles, while all India articles in our collection fell by 13.5%, so we compare shares of each pool, not counts. We scored 21 themes fixed in advance; one article can carry several.
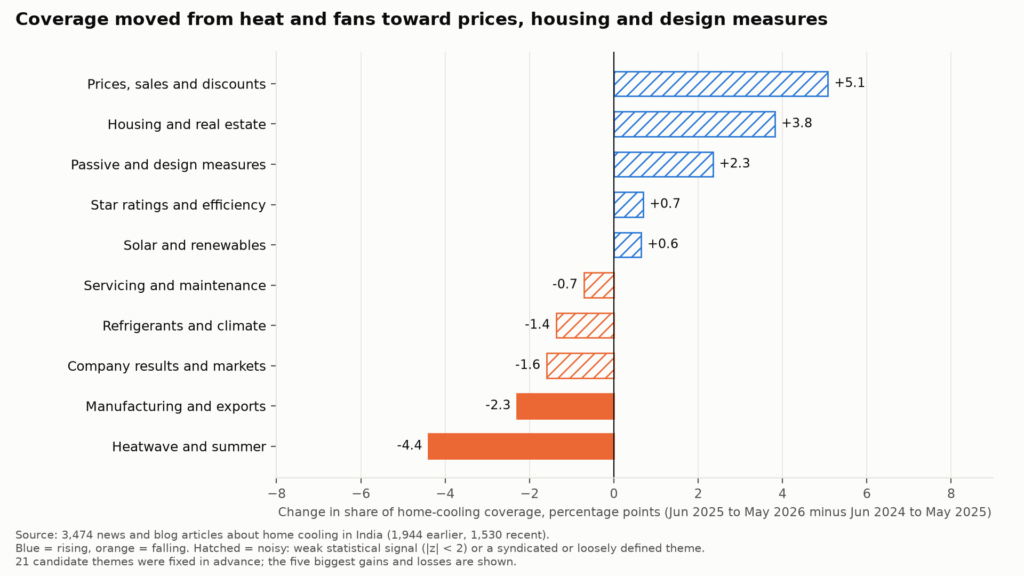
Chart 5. Change in each theme’s share of home-cooling coverage, percentage points. Blue bars rise, orange bars fall; hatched bars are noisy.
| Theme | Phrases matched (opening text or tags) | Share to May 2025 | Share to May 2026 | Change (points) |
| Prices, sales and discounts* | price, sale, discount, offer, deal, launch | 14.7% | 19.7% | +5.1 |
| Housing and real estate* | apartment, housing, builder, residential | 5.9% | 9.7% | +3.8 |
| Passive and design measures* | cool roof, insulation, ventilation, shading, jali | 4.6% | 6.9% | +2.3 |
| Star ratings and efficiency | star rating, inverter, energy saving | 9.8% | 10.5% | +0.7 |
| Solar and renewables* | solar, rooftop, renewable | 1.2% | 1.8% | +0.6 |
| Servicing and maintenance | servicing, repair, gas refill | 6.8% | 6.1% | -0.7 |
| Refrigerants and climate | refrigerant, emission, climate change | 12.3% | 11.0% | -1.4 |
| Company results and markets | shares, revenue, profit | 7.2% | 5.6% | -1.6 |
| Manufacturing and exports* | plant, factory, export, production | 12.0% | 9.7% | -2.3 |
| Heatwave and summer | heatwave, summer, scorching | 18.8% | 14.4% | -4.4 |
Table 1. Five rising and five falling themes. = noisy: promotional copy is often syndicated, property listings mention air conditioners as amenities, and small bases move easily.*
Coverage moved from heat and weather to shopping and housing. The heat-and-summer share fell by 4.4 points, and fans and coolers fell from 22.3% to 16.5% of the pool. The share of articles carrying a passive-measure phrase rose from 6.6% to 10.2% (128 to 156 articles, z = 3.9), though the biggest single gain was “cross ventilation”, from 1 to 21 articles, a jump that a handful of syndicated pieces could produce. “Cool roof” went from 8 to 13 articles and “passive cooling” from 3 to 10. Counts this small mean we read the direction, not the size.
Research attention: building design outgrows air-conditioning efficiency
Among journal articles from 2017 to 2025 with cooling-related building terms in the title, the total rose from 6,170 to 11,754 (1.9 times). Titles on roofs, walls and the building envelope grew 2.4 times (1,784 to 4,204), shading and glazing 2.0 times, thermal comfort 2.1 times and ventilation and passive cooling 1.7 times; air-conditioning efficiency titles grew 1.4 times (1,935 to 2,697). Papers naming India or an Indian city in the title are few: thermal-comfort titles rose from 9 in 2017 to 26 in 2025, and no design group exceeded 11 in 2025. The ICAP names passive design, thermal-comfort standards and cool-roof programmes as policy aims, but the evidence base on Indian homes remains thin in what we can count.
| Signal | Air conditioning | Fans, coolers, ventilation | Roof, wall, shading, glazing |
| Search interest, combined index | 587 | 300 | 44 |
| Share of search interest | 63% | 32% | 4.8% |
| Share of news mentions, recent 12 months | 74% | 16% | 10.0% |
| Company records mentioning the group | 1,263 | 490 | 409 |
| Research titles, 2025 vs 2017 | 1.4 times | 1.7 times (ventilation) | 2.0 to 2.4 times |
Table 2. Four signals for three groups. Company records for design add insulation (134) and glazing (275); some records appear in both.
What deserves attention in 2027
We do not forecast, and nothing here is advice. Reading the signals together, three points stand out.
- Design interest is growing from a very small base. Shading, roof and wall searches rose 35% to 45% in a year, but together they are under 5% of the searches measured.
- Timing is the same as air conditioning. Design searches peak in April with the heat, not before it, which leaves little lead time for work that takes weeks.
- The map is not one story. Design interest leans south and west and efficient air-conditioner interest leans north; a single national message would miss both.
Method and limits
Searches. Search-interest data for India. The 35 searches in Chart 1 were compared in groups of up to five on a shared scale, with “ceiling fan” as the common reference, over 1 November 2021 to 31 October 2026 (weekly values). Searches smaller than “window film” were measured against “jali design” and chained to the reference; they are approximate, and values below about 1 are rounded and unreliable. Values are relative indices, not search counts; we could not source absolute volumes, so the “top 25” is a ranking on a common index. The 35 searches were chosen by us from home-cooling vocabulary, so a search we did not test could rank anywhere. Seasonality and growth use monthly data for each search alone, 2016 to October 2026, with each series scaled to its own average; group indices are means of those scaled series. Search interest is also affected by how people word queries and by language: Hindi and regional-language queries are not captured here.
States. State scores come from regional search-interest data for 26 searches. A state’s score for a group is the mean of its scores on the searches in the group, requiring at least three of five roof searches and three of four shading searches, and four of six air-conditioner searches. Scores of 100 mark the most concentrated state for each search, so a small state can top a list on a few searches. Composites for design were available for 25 states and territories.
News and blog articles. Articles with country placed in India and a phrase from three vocabulary families in the opening text or tags: air-conditioner terms, fan and cooler terms, and passive-measure terms. 1 June 2024 to 31 May 2026; news ingest thins after May 2026 and the last month, May 2026, holds only 25 pool articles, so the recent window is in effect eleven months. The pool includes product copy, property listings and syndicated releases. The theme list of 21 was fixed in advance; the z statistic treats articles as independent, which is optimistic for syndicated copy. We removed “false ceiling” from the passive family after seeing that it lifted the family through décor stories.
Company records. India company records whose short or long description mentions listed phrases. The registry sample holds 351,457 India records; it is a sample of descriptions, not an official register, and we did not use statutory company-register data.
Research papers. Journal articles 2017 to 2025 with listed building and cooling terms in the title. Titles miss papers and count some loosely; India counts rely on country or city names in the title.
Data and analysis. The news, search and research-paper analysis in this article was run with Fliar Prism (Fliar Business Intelligence, 2026a), and the research tools it uses are published as the open-source Prism MCP (Fliar Business Intelligence, 2026b).
Not delivered against the original outline. We have no absolute search volumes, so no volume-ranked top 25; no drawings or images of design measures; no statutory company-register or sales data; and no district-level map. The map shows where people search, not where homes are built or cooled.
References
Fliar Business Intelligence (2026a) Fliar Prism: news, search and research-paper analysis [Data and analysis platform]. Available at: https://fliarbi.com/prism/ (Accessed: 1 November 2026).
Fliar Business Intelligence (2026b) Prism MCP: open-source research tools [Software]. GitHub. Available at: https://github.com/fliarbi/prism-mcp (Accessed: 1 November 2026).
Ministry of Environment, Forest and Climate Change (2019) India Cooling Action Plan. New Delhi: Ozone Cell, Government of India. Available at: https://ozonecell.nic.in/wp-content/uploads/2019/03/INDIA-COOLING-ACTION-PLAN-e-circulation-version080319.pdf (Accessed: 1 November 2026).